TRENDSYNC BUY/SELL BY SIMPLY_DANTE-FXTrendSync Buy and Sell Indicator
PS: Kindly give me feedback on the comment section, I will really appriciate
Created By: Simply_Dante-FX
About the Author:
Simply_Dante-FX is a skilled trader and developer with a focus on creating custom indicators and strategies for technical analysis. With a strong understanding of market behavior, he has designed the TrendSync Buy and Sell indicator to help traders identify high-probability buy and sell signals based on a combination of trend-following, momentum, and price action strategies. Simply_Dante-FX aims to provide tools that enhance trading decisions and improve the overall trading experience.
---
Description:
The TrendSync Buy and Sell indicator is designed to help traders identify potential buy and sell signals based on a combination of trend-following and momentum-based strategies. This custom indicator combines a range of technical tools, including the Simple Moving Average (SMA), Average True Range (ATR), and the Relative Strength Index (RSI), to filter and confirm entry points.
---
How It Works:
1. Trend Identification (SMA):
- The indicator uses the 200-period Simple Moving Average (SMA) to determine the overall trend direction.
- A Buy Signal is generated when the price is above the SMA, indicating an uptrend.
- A Sell Signal is generated when the price is below the SMA, indicating a downtrend.
2. Range Filtering (ATR):
- The Average True Range (ATR) is used to filter out signals that occur during periods of low volatility.
- The ATR is multiplied by a user-defined range filter multiplier (default is 1.2) to ensure the signal is coming from a sufficiently volatile market condition.
3. Momentum Confirmation (RSI):
- The RSI is used as a momentum filter. For Buy Signals, the RSI must be above the user-defined threshold (default is 50), indicating bullish momentum.
- For Sell Signals, the RSI must be below the opposite threshold (100 - RSI Threshold), indicating bearish momentum.
4.Price Action Conditions:
- Buy and Sell signals are further confirmed by price action:
- Buy Signal: Identifies higher lows during an uptrend.
- Sell Signal: Identifies higher highs during an uptrend, or lower highs in a downtrend.
5. Unified Signal:
- The script combines the various conditions to generate a unified signal, ensuring that only high-probability trade opportunities are highlighted.
How to Use It:
1.Buy Signal: Look for a green label below the bar, which indicates a potential buying opportunity. This signal is generated when:
- The price is above the 200-period SMA (uptrend).
- The RSI is above the defined threshold (momentum confirmation).
- The ATR-based range filter confirms sufficient market movement.
2. Sell Signal: Look for a red label above the bar, which indicates a potential selling opportunity. This signal is generated when:
- The price is below the 200-period SMA (downtrend).
- The RSI is below the defined threshold (momentum confirmation).
- The ATR-based range filter confirms sufficient market movement.
3. Visual Confirmation: The script also plots the 200-period SMA for easy identification of the overall trend direction.
4.Alert Setup: You can set up an alert using the “Unified Buy/Sell Alert” condition to notify you when a buy or sell signal is triggered.
Disclaimer:
- Risk Warning: The TrendSync Buy and Sell indicator is a tool for technical analysis and is not a guaranteed method for predicting market movements. Trading carries risk, and it is essential to use proper risk management techniques and not rely solely on any one indicator.
- No Financial Advice: This indicator does not constitute financial advice, and the author, Simply_Dante-FX, does not take responsibility for any trading losses or profits resulting from the use of this tool.
- Performance: Past performance is not indicative of future results. Always conduct your own analysis and use additional tools and strategies to confirm trade decisions.
Use this indicator with caution, and always ensure that you understand the risks involved in trading before committing real capital.
在腳本中搜尋"Buy sell"

Dynamic Buy/Sell VisualizationDynamic Trend Visualization Indicator
Description:
This simple and easy to use indicator has helped me stay in trades longer.
This indicator is designed to visually represent potential buy and sell signals based on the crossover of two Simple Moving Averages (SMA). It's crafted to assist traders in identifying trend directions in a straightforward manner, making it an excellent tool for both beginners and experienced traders.
Features:
Customizable Moving Averages: Users can adjust the period length for both short-term (default: 10) and long-term (default: 50) SMAs to suit their trading strategy.
Visual Signals: Dynamic lines appear at the points of SMA crossover, with labels to indicate 'BUY' or 'SELL' opportunities.
Color and Style Customization: Customize the appearance of the buy and sell lines for better chart readability.
Alert Functionality: Alerts are set up to notify users when a crossover indicating a buy or sell condition occurs.
How It Works:
A 'BUY' signal is generated when the short-term SMA crosses above the long-term SMA, suggesting an upward trend.
A 'SELL' signal is indicated when the short-term SMA crosses below the long-term SMA, pointing to a potential downward trend.
Use Cases:
Trend Following: Ideal for markets with clear trends. For example, if trading EUR/USD on a daily chart, setting the short SMA to 10 days and the long SMA to 50 days might help in capturing longer-term trends.
Scalping: In a volatile market, setting shorter periods (e.g., 5 for short SMA and 20 for long SMA) might catch quicker trend changes, suitable for scalping.
Examples of how to use
* Short-term for Quick Trades:
SMA 5 and SMA 21:
Purpose: This combination is tailored for day traders or those looking to engage in scalping. The 5 SMA will react rapidly to price changes, providing early signals for buy or sell opportunities. The 21 SMA, being a Fibonacci number, offers a slightly longer-term view to confirm the short-term trend, helping to filter out minor fluctuations that might lead to false signals.
* Middle-term for Swing Trading:
SMA 10 and SMA 50:
Purpose: Suited for swing traders who aim to capitalize on medium-term trends. The 10 SMA picks up on immediate market movements, while the 50 SMA gives insight into the medium-term direction. This setup helps in identifying when a short-term trend aligns with a longer-term trend, providing a good balance for trades that might last several days to a couple of weeks.
* Long-term Trading:
SMA 50 and SMA 200:
Purpose: Investors focusing on long-term trends would benefit from this pair. The crossover of the 50 SMA over the 200 SMA can indicate the beginning or end of major market trends, ideal for making decisions about long-term holdings that might span months or years.
Example Strategy if not using the Buy / Sell Label Alerts:
Entry Signal: Enter a long position when the shorter SMA crosses above the longer SMA. For example:
SMA 10 crosses above SMA 50 for a medium-term bullish signal.
Exit Signal: Consider exiting or initiating a short position when:
SMA 10 crosses below SMA 50, suggesting a bearish turn in the medium-term trend.
Confirmation: Use these crossovers in conjunction with other indicators like volume or momentum indicators for better confirmation. For instance, if you're using the 5/21 combination, look for volume spikes on crossovers to confirm the move's strength.
When Not to Use:
Sideways or Range-Bound Markets: The indicator might generate many false signals in a non-trending market, leading to potential losses.
High Volatility Without Clear Trends: Rapid price movements without a consistent direction can result in misleading crossovers.
As a Standalone Tool: It should not be used in isolation. Combining with other indicators like RSI or MACD for confirmation can enhance trading decisions.
Practical Example:
Buy Signal: If you're watching Apple Inc. (AAPL) on a weekly chart, a crossover where the 10-week SMA moves above the 50-week SMA could suggest a buying opportunity, especially if confirmed by volume increase or other technical indicators.
Sell Signal: Conversely, if the 10-week SMA dips below the 50-week SMA, it might be time to consider selling, particularly if other bearish signals are present.
Conclusion:
The "Dynamic Trend Visualization" indicator provides a visual aid for trend-following strategies, offering customization and alert features to streamline the trading process. However, it's crucial to use this in conjunction with other analysis methods to mitigate the risks of false signals or market anomalies.
Legal Disclaimer:
This indicator is for educational purposes only. It does not guarantee profits or provide investment advice. Trading involves risk; please conduct thorough or consult with a financial advisor. The creator is not responsible for any losses incurred. By using this indicator, you agree to these terms.

True Strength Index with Buy/Sell Signals and AlertsThe True Strength Index (TSI) is a momentum oscillator that helps traders identify trends and potential reversal points in the market. Here’s how it works:
1. **Price Change Calculation**:
- **`pc = ta.change(price)`**: This calculates the change in price (current price minus the previous price).
2. **Double Smoothing**:
- **`double_smooth(src, long, short)`**: This function smooths the price change data twice using two Exponential Moving Averages (EMAs):
- The first EMA smooths the raw data.
- The second EMA smooths the result of the first EMA.
- **`double_smoothed_pc`**: The double-smoothed price change.
- **`double_smoothed_abs_pc`**: The double-smoothed absolute price change, which helps normalize the TSI value.
3. **TSI Calculation**:
- **`tsi_value = 100 * (double_smoothed_pc / double_smoothed_abs_pc)`**: This calculates the TSI by dividing the double-smoothed price change by the double-smoothed absolute price change, then multiplying by 100 to scale the value.
- The TSI oscillates around the zero line, indicating momentum. Positive values suggest bullish momentum, while negative values suggest bearish momentum.
4. **Signal Line**:
- **`signal_line = ta.ema(tsi_value, signal)`**: This creates a signal line by applying another EMA to the TSI value. The signal line is typically used to identify entry and exit points.
5. **Buy and Sell Signals**:
- **Buy Signal**: Occurs when the TSI crosses above the signal line (`ta.crossover(tsi_value, signal_line)`), indicating that bullish momentum is strengthening, which might suggest a buying opportunity.
- **Sell Signal**: Occurs when the TSI crosses below the signal line (`ta.crossunder(tsi_value, signal_line)`), indicating that bearish momentum is strengthening, which might suggest a selling opportunity.
6. **Visual Representation**:
- The TSI line and the signal line are plotted on the chart.
- Buy signals are marked with green "BUY" labels below the bars, and sell signals are marked with red "SELL" labels above the bars.
**How to Use It**:
- **Trend Identification**: When the TSI is above zero, it suggests an uptrend; when it's below zero, it suggests a downtrend.
- **Buy/Sell Signals**: Traders often enter a buy trade when the TSI crosses above the signal line and enter a sell trade when the TSI crosses below the signal line.
- **Divergences**: TSI can also be used to spot divergences between the indicator and price action, which can signal potential reversals.
The TSI is particularly useful in identifying the strength of a trend and the potential turning points, making it valuable for trend-following and swing trading strategies.

Chande Momentum Oscillator (CMO) Buy Sell Strategy [TradeDots]The "Chande Momentum Oscillator (CMO) Buy Sell Strategy" leverages the CMO indicator to identify short-term buy and sell opportunities.
HOW DOES IT WORK
The standard CMO indicator measures the difference between recent gains and losses, divided by the total price movement over the same period. However, this version of the CMO has some limitations.
The primary disadvantage of the original CMO is its responsiveness to short-term volatility, making the signals less smooth and more erratic, especially in fluctuating markets. This instability can lead to misleading buy or sell signals.
To address this, we integrated the concept from the Moving Average Convergence Divergence (MACD) indicator. By applying a 9-period exponential moving average (EMA) to the CMO line, we obtained a smoothed signal line. This line acts as a filter, identifying confirmed overbought or oversold states, thereby reducing the number of false signals.
Similar to the MACD histogram, we generate columns representing the difference between the CMO and its signal line, reflecting market momentum. We use this momentum indicator as a criterion for entry and exit points. Trades are executed when there's a convergence of CMO and signal lines during an oversold state, and they are closed when the CMO line diverges from the signal line, indicating increased selling pressure.
APPLICATION
Since the 9-period EMA smooths the CMO line, it's less susceptible to extreme price fluctuations. However, this smoothing also makes it more challenging to breach the original +50 and -50 benchmarks.
To increase trading opportunities, we've tightened the boundary ranges. Users can customize the target benchmark lines in the settings to adjust for the volatility of the underlying asset.
The 'cool down period' is essentially the number of bars that await before the next signal generation. This feature is employed to dodge the occurrence of multiple signals in a short period.
DEFAULT SETUP
Commission: 0.01%
Initial Capital: $10,000
Equity per Trade: 80%
Signal Cool Down Period: 5
RISK DISCLAIMER
Trading entails substantial risk, and most day traders incur losses. All content, tools, scripts, articles, and education provided by TradeDots serve purely informational and educational purposes. Past performances are not definitive predictors of future results.

Multi Timeframe RSI Buy Sell Strategy [TradeDots]The "Multi Timeframe RSI Buy/Sell Strategy" is a trading strategy that utilizes Relative Strength Index (RSI) indicators from multiple timeframes to provide buy and sell signals.
This strategy allows for extensive customization, supporting up to three distinct RSIs, each configurable with its own timeframe, length, and data source.
HOW DOES IT WORK
This strategy integrates up to three RSIs, each selectable from different timeframes and customizable in terms of length and source. Users have the flexibility to define the number of active RSIs. These selections visualize as plotted lines on the chart, enhancing interpretability.
Users can also manage the moving average of the selected RSI lines. When multiple RSIs are active, the moving average is calculated based on these active lines' average value.
The color intensity of the moving average line changes as it approaches predefined buying or selling thresholds, alerting users to potential signal generation.
A buy or sell signal is generated when all active RSI lines simultaneously cross their respective threshold lines. Concurrently, a label will appear on the chart to signify the order placement.
For those preferring not to display order information or activate the strategy, an "Enable backtest" option is provided in the settings for toggling activation.
APPLICATION
The strategy leverages multiple RSIs to detect extreme market conditions across various timeframes without the need for manual timeframe switching.
This feature is invaluable for identifying divergences across timeframes, such as detecting potential short-term reversals within broader trends, thereby aiding traders in making better trading decisions and potentially avoiding losses.
DEFAULT SETUP
Commission: 0.01%
Initial Capital: $10,000
Equity per Trade: 60%
RISK DISCLAIMER
Trading entails substantial risk, and most day traders incur losses. All content, tools, scripts, articles, and education provided by TradeDots serve purely informational and educational purposes. Past performances are not definitive predictors of future results.
TradeDots Stochastic Z-Score

Uptrick: RSI MA Buying/Selling signalsIndicator Purpose:
This indicator, titled "Uptrick: RSI MA Buying/Selling signals" or "UpRSIMA," aims to provide buying and selling signals based on the Moving Average (MA) of the Relative Strength Index (RSI).
It plots the RSI MA line and highlights whether the RSI MA value is above or below 50, indicating potential bullish or bearish signals, respectively.
RSI Calculation:
The script calculates the RSI using a user-defined length parameter (default is 14) and a specified source (typically the closing price).
It then computes the MA of the RSI using the Recursive Moving Average (RMA) function applied to the RSI values.
Color Representation:
The color of the RSI MA line is determined based on whether it's above or below the neutral level of 50.
If the RSI MA is above 50, indicating potential bullish signals, the color is set to green; otherwise, it's set to red for potential bearish signals.
Plotting:
The RSI MA line is plotted on the chart with the specified color based on its value relative to 50.
Additionally, a horizontal line is drawn at y = 50 to visually represent the neutral level.
Histogram bars are also added to visually represent the difference between the RSI MA and the neutral level, with green bars indicating bullish signals and red bars indicating bearish signals.
User Interface:
The indicator is designed to be used as an overlay on price charts, allowing traders to easily visualize potential buying and selling signals based on RSI MA crossovers and levels relative to 50.
Overall, the "Uptrick: RSI MA Buying/Selling signals" indicator offers traders insights into potential trend reversals or continuations based on the moving average of the Relative Strength Index, aiding them in making informed trading decisions.

Movement based on Buying/Selling VolumeDescription:
The "Buying Selling Volume" indicator calculates buying and selling volumes based on price movements within a specified lookback period. It then computes exponential moving averages (EMAs) of these volumes to determine trend direction. The indicator visually represents trend direction on the chart.
Volume Calculation and Normalization (Lines #1 - #12):
The indicator first computes the buying volume (BV) and selling volume (SV) based on price movements within the specified lookback period. These volumes are calculated proportionally to the distance between the closing price and the high and low of each candle.
To ensure consistent behavior and prevent division by zero, the volumes are normalized using a conditional statement to handle cases where the high and low are equal, which implies a lack of price movement.
Additionally, the volume (vol) is normalized to ensure non-zero division in subsequent calculations.
Total Volume and Proportional Volume Calculation (Lines #13 - #20):
The total volume (TP) is computed by summing the buying and selling volumes.
The proportional buying volume (BPV) and selling volume (SPV) are then calculated based on their respective contributions to the total volume.
These proportional volumes are scaled by the total volume to ensure accurate representation relative to market activity.
Evaluating Buying and Selling Pressure (Lines #21 - #24):
The code segment assigns positive or negative values to represent buying and selling pressure, respectively, based on the comparison between BPV and SPV. This step involves determining whether the buying pressure exceeds the selling pressure or vice versa.
The calculated values, denoted as BPc1 and SPc1, encapsulate the relative strength of buying and selling forces within the market.
EMA Calculation and Trend Identification (Lines #25 - #32):
The BPc1 and SPc1 values are subjected to exponential moving average (EMA) calculations using the specified lookback period (LookbackL). This process involves smoothing out the buying and selling pressure data to reveal underlying trends.
The resulting EMAs, represented by ema1B and ema1S, serve as crucial indicators of trend direction. A bullish trend is indicated when ema1B exceeds ema1S, while a bearish trend is signaled when ema1B falls below ema1S.
Secondary Volume Analysis and Trend Confirmation (Lines #33 - #42):
A similar volume analysis and EMA calculation process is repeated in this segment, using a different lookback period (LookbackL2). This allows for a secondary assessment of market dynamics and trend direction.
The resulting EMAs, denoted as ema1B2 and ema1S2, are compared to validate the trend direction identified in the primary analysis.
Visual Representation and Trend Display (Lines #43 - #46):
Finally, the indicator visualizes the identified trends on the chart by plotting colored shapes based on the comparison between the primary and secondary trend directions.
A green color indicates alignment in bullish trends, a red color signifies alignment in bearish trends, while a neutral color (gray) represents no clear consensus between the primary and secondary analyses.
Ideal Usage:
1. **Trend Confirmation:** Traders can use this indicator to confirm trend direction before entering trades.
2. **Reversal Signals:** Changes in trend direction, indicated by shifts in plotted shape colors, can signal potential market reversals.
Warnings:
1. **False Signals:** Like any technical indicator, false signals may occur, especially during low-volume or choppy market conditions. Additional analysis and risk management techniques are essential to mitigate potential losses.
2. **Parameter Sensitivity:** Adjusting lookback periods can impact the indicator's sensitivity to price movements. Traders should test different parameter settings and consider market conditions when using the indicator.

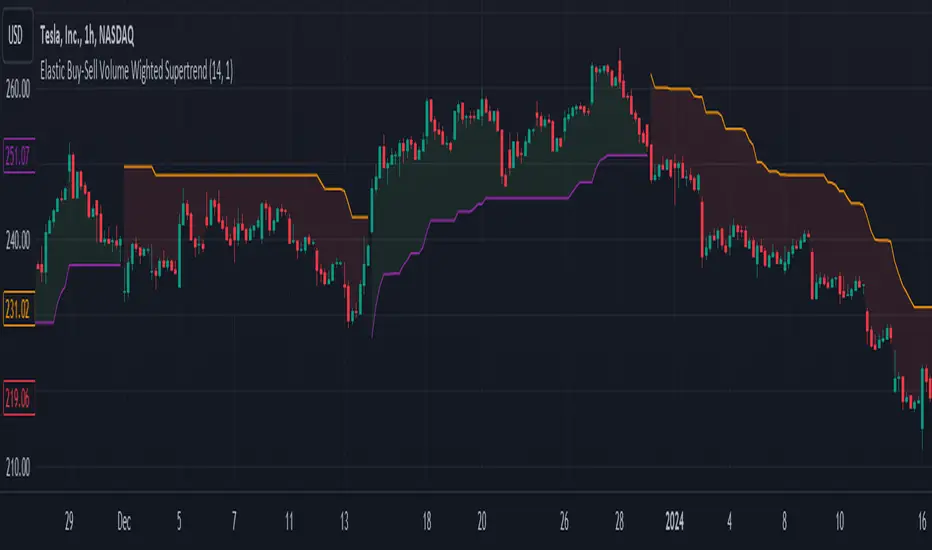
Elastic Buy-Sell Volume Wighted SupertrendCredits: This uses Trading View's buy and sell volume script and the Super trend script.
Elastic Buy-Sell Volume Wighted Supertrend can be used like a traditional supertrend indicator however we do not have to arbitrarily choose a multiplier depending on the stock and time frame the code dynamically adjust the multiplier and this is described below.
The buy and sell ATR (Average True Range) play a crucial role in determining the levels for potential buy and sell signals in the market. These ATR values are calculated based on volume-weighted averages, providing insights into the strength of buying and selling pressures. By incorporating volume into the ATR calculation, the indicator can better adapt to market dynamics, as volume often reflects the intensity of price movements. Instead of using Volume as whole this uses up and down volume derived from lower time frames which is used to calculate buy and sell ATR.
The multiplier is a key factor in the Supertrend calculation, which adjusts the width of the trend bands. The multiplier in this indicator dynamically adjusts itself based on two key components: the ratio of the asset's Average True Range (ATR) to that of a broader market benchmark and the coefficient of variation (CV) of the True Range (TR). The ratio comparison provides a historical context of the asset's volatility relative to the wider market over a longer time frame, while the CV accounts for short-term fluctuations in volatility.
By comparing the asset's ATR to that of the benchmark, traders gain insights into the asset's historical volatility behavior. A higher multiplier suggests that the asset's volatility has historically exceeded that of the benchmark, indicating potentially larger price movements compared to the broader market. Conversely, a lower multiplier suggests the opposite.
The CV component measures short-term variability in the asset's volatility, ensuring that the multiplier adapts to both long-term trends and short-term fluctuations. This combined approach enables traders to make informed decisions, considering both historical volatility relative to the broader market and short-term variability. Ultimately, the dynamic multiplier enhances traders' ability to adjust their strategies effectively across various market conditions.
Overall, the use of buy and sell ATR, along with a dynamically adjusted multiplier, enhances the indicator's ability to identify trend directions and to use a dynamic stop loss level.
thuyliemforever EMA Scalper - Buy/Sellthuyliemforever EMA Scalper - Buy/Sell
Indicator that help you make decision buy or sell.

MM SIGMA STC+ADXThe Schaff Trend Cycle (STC) is a charting indicator that is commonly used to identify market trends and provide buy and sell signals to traders. Developed in 1999 by noted currency trader Doug Schaff, STC is a type of oscillator and is based on the assumption that, regardless of time frame, currency trends accelerate and decelerate in cyclical patterns.12
How STC Works
Many traders are familiar with the moving average convergence/divergence (MACD) charting tool, which is an indicator that is used to forecast price action and is notorious for lagging due to its slow responsive signal line . By contrast, STC’s signal line enables it to detect trends sooner. In fact, it typically identifies up and downtrends long before MACD indicator.
While STC is computed using the same exponential moving averages as MACD, it adds a novel cycle component to improve accuracy and reliability. While MACD is simply computed using a series of moving average, the cycle aspect of STC is based on time (e.g., number of days).
It should also be noted that, although STC was developed primarily for fast currency markets, it may be effectively employed across all markets, just like MACD. It can be applied to intraday charts, such as five minutes or one-hour charts, as well as daily, weekly, or monthly time frames.
Introduction to ADX
ADX is used to quantify trend strength. ADX calculations are based on a moving average of price range expansion over a given period of time. The default setting is 14 bars, although other time periods can be used.1 ADX can be used on any trading vehicle such as stocks, mutual funds, exchange-traded funds and futures.
ADX is plotted as a single line with values ranging from a low of zero to a high of 100. ADX is non-directional; it registers trend strength whether price is trending up or down.2 The indicator is usually plotted in the same window as the two directional movement indicator (DMI) lines, from which ADX is derived (shown below).Quantifying Trend Strength
ADX values help traders identify the strongest and most profitable trends to trade. The values are also important for distinguishing between trending and non-trending conditions. Many traders will use ADX readings above 25 to suggest that the trend is strong enough for trend-trading strategies. Conversely, when ADX is below 25, many will avoid trend-trading strategies.
ADX Value Trend Strength
0-25 Absent or Weak Trend
25-50 Strong Trend
50-75 Very Strong Trend
75-100 Extremely Strong Trend
Low ADX is usually a sign of accumulation or distribution. When ADX is below 25 for more than 30 bars, price enters range conditions, and price patterns are often easier to identify. Price then moves up and down between resistance and support to find selling and buying interest, respectively. From low ADX conditions, price will eventually break out into a trend. Below, the price moves from a low ADX price channel to an uptrend with strong ADX.
Added Buy/Sell alerts
ADX filters based on the threshold you put in the settings.
great for trend and trade confirmation

Long Term Buy/Sell Signal by BonyThis script attempts to use Exponential Moving averages (short-term and long-term convergence) of different lengths in order to identify trade entries and exits for bullish & bearish trades. I would strongly recommend using this as a guide to enter or exit long-term swing trades on growth names such as Apple, Tesla, Microsoft to keep your emotions out of the trading. You use this script by entering a trade when it signals a green BUY signal with a UP arrow and exiting when it signals red. The general idea is that one is fast and one is slow-moving EMA and these indicate when to buy/sell when they crossover the overbought/sold lines.
Disclaimer:
This script is for educational purposes only. The market is always moving up or down, so always trade with caution and use your best judgment for every trade.

ExpertToken Buy/Sell SignalExpertToken Buy/Sell Signal เป็นอินดิเคเตอร์ที่สามารถบอกสัญญาณการซื้อขาย และบอกแนวโน้มของราคาได้
หลักการทำงาน
สัญญาณ Buy/Sell ถูกกำหนดโดยการใช่ CCI วัดโมเมนตัมการซื้อขาย หาก CCI ส่งสัญญาณว่าแรงขายเยอะเกินไป และมีแนวโน้มราคาจะกลับตัวสูงขึ้น ก็จะส่งสัญญาณ Buy แต่หาก CCI ส่งสัญญาณว่าแรงซื้อเยอะเกินไป และมีแนวโน้มราคาจะกลับตัวต่ำลง ก็จะส่งสัญญาณ Buy
เส้นสีน้ำเงินเป็นเส้น EMA 200 ไว้ใช้บอกแนวโน้มระยะยาว
เมฆขาว ประกอบไปด้วย เส้นสีเขียว(เส้น EMA เคลื่อนที่เร็ว) และเส้นสีแดง(เส้น EMA เคลื่อนที่ช้า) โดยให้ทั้งสองเส้นตัดกันเพื่อบอกสัญญาณการกลับตัว ค่าเริ่มต้นของทั้งสองเส้นเป็น 20, 50
วิธีการใช้อินดิเคเตอร์
ขั้นตอนแรก ให้ดูเส้นสีน้ำ หากราคาอยู่เหนือเส้นสีน้ำเงิน อาจมีแนวโน้มที่ราคาจะขึ้น
ขั้นตอนที่สอง ให้ดูเมฆ ที่ถูกสร้างขึ้นโดยการน้ำเส้น EMA 2 เส้น สีเขียวและสีแดง หากเส้นสีเขียวอยู่เหนือเส้นสีแดง ราคาอาจมีแนวโน้มที่ขึ้น หากเส้นสีแดงอยู่เหนือเส้นสีเขียว ราคาอาจจะลง แต่ถ้าหากราคาอยู่ในโซนเมฆขาว(ราคาอยู่ระหว่างเส้นเขียวกับสีแดง) ราคาอยู่ในช่วงเป็นกลาง
สุดท้าย หากมีข้อความบอกสัญญาณบอกว่า Buy หรือ Sell ให้พิจารณาจากสองขั้นตอนก่อนหน้านี้ หากมันสอดคล่องกับสองขั้นตอนก่อนหน้านี้ ให้พิจารณาการเปิดตำแหน่งตามสัญญาณ
################################################################################################
ExpertToken Buy/Sell Signal is an indicator that can give you trading signals. and tell the trend of the price
How it works
Buy/Sell signals are determined by using CCI to measure trading momentum.
If CCI signals too much selling pressure and there is a tendency for the price to reverse higher It sends a buy signal, but if CCI signals that it is overbought and the price tends to reverse lower will send signal Buy
The blue line is the EMA 200 line to indicate a long-term trend.
The white cloud consists of a green line (fast moving EMA line) and a red line (slow moving EMA line), with the two lines intersecting to signal a reversal. The default values for both lines are 20, 50.
How to use the indicator
The first step is to look at the watercolor lines. If the price is above the blue line There may be a tendency for prices to go up.
The second step is to look at the clouds that are created by watering the 2 EMA lines, green and red. If the green line is above the red line The price may tend to go up. If the red line is above the green line, the price may go down, but if the price is in the white cloud zone (the price is between the green and red line), the price is in the neutral range.
Finally, if there is a signal to say Buy or Sell, consider the previous two steps. If it complies with the previous two steps Consider opening a position based on a signal.


Range Delta Heiken Ashi Bollinger|Buy/Sell |OB & OS CandlesPurpose: Mathematically represent buying and selling zones for Daily/ Weekly Traders
Indicator: Calculates moving average of the candle's body with respect to the daily trading range
Buy and Sell Signals: Calculates Bollinger Range with Max/Min and Buy/Sell Bollinger signals
Overbought and Oversold Signals: Candlesticks show overbought and oversold conditions
Level of Difficulty: This indicator was written to make life easier. Follow the Rules and anyone can use it.
Rule 1: Buy when candlestick is below "purple" line
Rule 2: Sell when candlestick is above "blue" line
Rule 3: Add bollinger bands to your currency chart
Rule 4: Confirm indicator bollinger bands with currency chart's bollinger bands
Rule 5: Trade in direction of trend
Rule 6: As with all trading; no indicators are fool proof. Please trade responsibly.
****Full Customization for you****
Suggestion 1: Add bollinger bands to currency chart to improve probability
Suggestion 2: Trade the direction of Trend
Suggestion 3: This indicator works very well with Ranged Markets (or use Suggestion 2)
Disclaimer 1: This Indicator words best on Daily and Weekly time frames
Disclaimer 2: Enjoy the Indicator and feel free to ADD COMMENTS; I worked very hard for you and me :)

GEEKSDOBYTE IFVG w/ Buy/Sell Signals1. Inputs & Configuration
Swing Lookback (swingLen)
Controls how many bars on each side are checked to mark a swing high or swing low (default = 5).
Booleans to Toggle Plotting
showSwings – Show small triangle markers at swing highs/lows
showFVG – Show Fair Value Gap zones
showSignals – Show “BUY”/“SELL” labels when price inverts an FVG
showDDLine – Show a yellow “DD” line at the close of the inversion bar
showCE – Show an orange dashed “CE” line at the midpoint of the gap area
2. Swing High / Low Detection
isSwingHigh = ta.pivothigh(high, swingLen, swingLen)
Marks a bar as a swing high if its high is higher than the highs of the previous swingLen bars and the next swingLen bars.
isSwingLow = ta.pivotlow(low, swingLen, swingLen)
Marks a bar as a swing low if its low is lower than the lows of the previous and next swingLen bars.
Plotting
If showSwings is true, small red downward triangles appear above swing highs, and green upward triangles below swing lows.
3. Fair Value Gap (3‐Bar) Identification
A Fair Value Gap (FVG) is defined here using a simple three‐bar logic (sometimes called an “inefficiency” in price):
Bullish FVG (bullFVG)
Checks if, two bars ago, the low of that bar (low ) is strictly greater than the current bar’s high (high).
In other words:
bullFVG = low > high
Bearish FVG (bearFVG)
Checks if, two bars ago, the high of that bar (high ) is strictly less than the current bar’s low (low).
In other words:
bearFVG = high < low
When either condition is true, it identifies a three‐bar “gap” or unfilled imbalance in the market.
4. Drawing FVG Zones
If showFVG is enabled, each time a bullish or bearish FVG is detected:
Bullish FVG Zone
Draws a semi‐transparent green box from the bar two bars ago (where the gap began) at low up to the current bar’s high.
Bearish FVG Zone
Draws a semi‐transparent red box from the bar two bars ago at high down to the current bar’s low.
These colored boxes visually highlight the “fair value imbalance” area on the chart.
5. Inversion (Fill) Detection & Entry Signals
An inversion is defined as the price “closing through” that previously drawn FVG:
Bullish Inversion (bullInversion)
Occurs when a bullish FVG was identified on bar-2 (bullFVG), and on the current bar the close is greater than that old bar-2 low:
bullInversion = bullFVG and close > low
Bearish Inversion (bearInversion)
Occurs when a bearish FVG was identified on bar-2 (bearFVG), and on the current bar the close is lower than that old bar-2 high:
bearInversion = bearFVG and close < high
When an inversion is true, the indicator optionally draws two lines and a label (depending on input toggles):
Draw “DD” Line (yellow, solid)
Plots a horizontal yellow line from the current bar’s close price extending five bars forward (bar_index + 5). This is often referred to as a “Demand/Daily Demand” line, marking where price inverted the gap.
Draw “CE” Line (orange, dashed)
Calculates the midpoint (ce) of the original FVG zone.
For a bullish inversion:
ce = (low + high) / 2
For a bearish inversion:
ce = (high + low) / 2
Plots a horizontal dashed orange line at that midpoint for five bars forward.
Plot Label (“BUY” / “SELL”)
If showSignals is true, a green “BUY” label is placed at the low of the current bar when a bullish inversion occurs.
Likewise, a red “SELL” label at the high of the current bar when a bearish inversion happens.
6. Putting It All Together
Swing Markers (Optional):
Visually confirm recent swing highs and swing lows with small triangles.
FVG Zones (Optional):
Highlight areas where price left a 3-bar gap (bullish in green, bearish in red).
Inversion Confirmation:
Wait for price to close beyond the old FVG boundary.
Once that happens, draw the yellow “DD” line at the close, the orange dashed “CE” line at the zone’s midpoint, and place a “BUY” or “SELL” label exactly on that bar.
User Controls:
All of the above elements can be individually toggled on/off (showSwings, showFVG, showSignals, showDDLine, showCE).
In Practice
A bullish FVG forms whenever a strong drop leaves a gap in liquidity (three bars ago low > current high).
When price later “fills” that gap by closing above the old low, the script signals a potential long entry (BUY), draws a demand line at the closing price, and marks the midpoint of that gap.
Conversely, a bearish FVG marks a potential short zone (three bars ago high < current low). When price closes below that gap’s high, it signals a SELL, with similar lines drawn.
By combining these elements, the indicator helps users visually identify inefficiencies (FVGs), confirm when price inverts/fills them, and place straightforward buy/sell labels alongside reference lines for trade management.

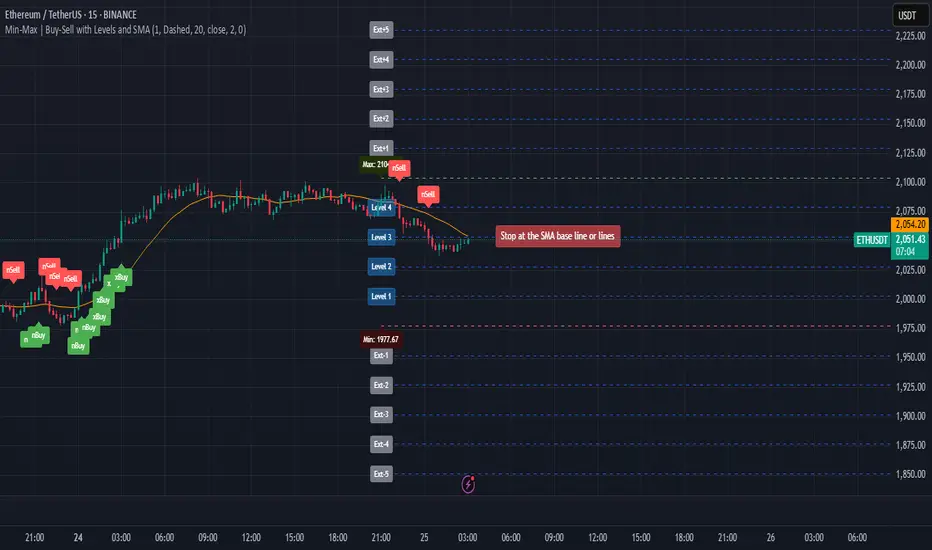
Min-Max | Buy-Sell Alert with LevelsMin-Max | Buy-Sell Alert with Levels
Description:
The Min-Max | Buy-Sell Alert with Levels indicator is a powerful tool designed to help traders identify key levels of support and resistance based on the previous day's high and low prices. It plots horizontal lines for the previous day's minimum (Min) and maximum (Max) prices, along with four intermediate levels (Stop Loss 1 to Stop Loss 4) calculated as equal percentage steps between the Min and Max.
This indicator is perfect for traders who want to:
Identify potential entry points when the price returns within the Min-Max range.
Set stop-loss levels based on the calculated intermediate levels.
Receive alerts for buy, sell, and stop-loss conditions.
Key Features:
Previous Day's Min and Max Lines:
Automatically plots the Min (red line) and Max (green line) of the previous day.
These levels act as dynamic support and resistance zones.
Intermediate Stop Loss Levels:
Calculates and plots four intermediate levels (Stop Loss 1 to Stop Loss 4) between the Min and Max.
Each level is equally spaced, representing potential stop-loss or take-profit zones.
Customizable Alerts:
Buy Alert: Triggered when the price returns within the Min-Max range after breaking below the Min.
Sell Alert: Triggered when the price returns within the Min-Max range after breaking above the Max.
Stop Loss Alerts: Triggered when the price reaches any of the four intermediate levels (Stop Loss 1 to Stop Loss 4).
Customizable Appearance:
Adjust the thickness, color, and style (solid, dashed, dotted) of the lines.
Customize the colors of the Stop Loss labels for better visualization.
Labels on the Chart:
Displays "Buy" and "Sell" labels on the chart when the respective conditions are met.
Labels for Stop Loss levels are also displayed for easy reference.
How to Use:
Add the indicator to your chart.
Customize the settings (line colors, thickness, and alert preferences) in the indicator's settings panel.
Use the Min and Max lines as dynamic support and resistance levels.
Monitor the intermediate levels (Stop Loss 1 to Stop Loss 4) for potential stop-loss or take-profit zones.
Set up alerts for Buy, Sell, and Stop Loss conditions to stay informed about key price movements.
Why Use This Indicator?
Simple and Effective: Focuses on the most important levels from the previous day.
Customizable: Tailor the indicator to match your trading style and preferences.
Alerts: Never miss a trading opportunity with customizable alerts for key conditions.
Settings:
Line Thickness: Adjust the thickness of the Min, Max, and intermediate lines.
Line Colors: Customize the colors of the Min, Max, and intermediate lines.
Line Style: Choose between solid, dashed, or dotted lines.
Stop Loss Label Colors: Customize the colors of the Stop Loss labels.
Alerts: Enable or disable alerts for Buy, Sell, and Stop Loss conditions.
Ideal For:
Day traders and swing traders.
Traders who rely on support and resistance levels.
Anyone looking for a clear and customizable tool to identify key price levels.
Disclaimer:
This indicator is for educational and informational purposes only. It does not constitute financial advice. Always conduct your own analysis and trade responsibly.
Get Started Today!
Add the Min-Max | Buy-Sell Alert with Levels indicator to your chart and take your trading to the next level. Customize it to fit your strategy and never miss a key trading opportunity again!
EMA Clouds with Strict Buy/Sell SignalsEMA Clouds with Strict Buy/Sell Signals - Precision Trading Unleashed
Unlock the power of trend-following precision with the EMA Clouds with Strict Buy/Sell Signals indicator, a sophisticated tool built for traders who demand reliability and clarity in their decision-making. Inspired by the legendary Ripster EMA Clouds, this indicator takes the classic cloud concept to the next level by incorporating stricter, high-confidence signals—perfect for navigating the markets on 15-minute or higher timeframes.
Why You’ll Want This on Your Chart:
Dual EMA Clouds for Crystal-Clear Trends: Watch as two dynamic clouds—formed by carefully paired Exponential Moving Averages (8/21 and 34/50)—paint a vivid picture of market momentum. The green short-term cloud and red long-term cloud provide an intuitive, at-a-glance view of trend direction and strength.
Stricter Signals, Fewer False Moves: Tired of chasing weak signals? This indicator only triggers buy and sell signals when the stars align: a cloud crossover (short-term crossing above or below long-term) and price confirmation above or below both clouds. The result? Fewer trades, higher conviction, and a cleaner chart.
Customizable Timeframe Power: Whether you’re a scalper on the 15-minute chart or a swing trader on the daily, tailor the clouds to your preferred higher timeframe (15min, 30min, 1hr, 4hr, or daily) for seamless integration into your strategy.
Visual Mastery Meets Actionable Alerts: Green buy triangles below the bars and red sell triangles above them make spotting opportunities effortless. Pair this with built-in alerts, and you’ll never miss a high-probability trade again.
How It Works:
Buy Signal: Triggers when the short-term cloud crosses above the long-term cloud and the price surges above both, signaling a robust bullish breakout.
Sell Signal: Activates when the short-term cloud dips below the long-term cloud and the price falls beneath both, confirming bearish dominance.
Cloud Visualization: The green cloud (8/21 EMA) tracks fast-moving trends, while the red cloud (34/50 EMA) anchors the broader market direction—together, they filter noise and spotlight tradable moves.
Why Traders Will Love It:
Designed for those who value precision over guesswork, this indicator cuts through market clutter to deliver signals you can trust. Whether you’re trading stocks, forex, crypto, or futures, its adaptability and strict logic make it a must-have tool for serious traders. Customize the EMA lengths, tweak the timeframe, and watch your edge sharpen.
Add EMA Clouds with Strict Buy/Sell Signals to your chart today and experience the confidence of trading with a tool that’s as disciplined as you are. Your next big move is waiting—don’t let it slip away.

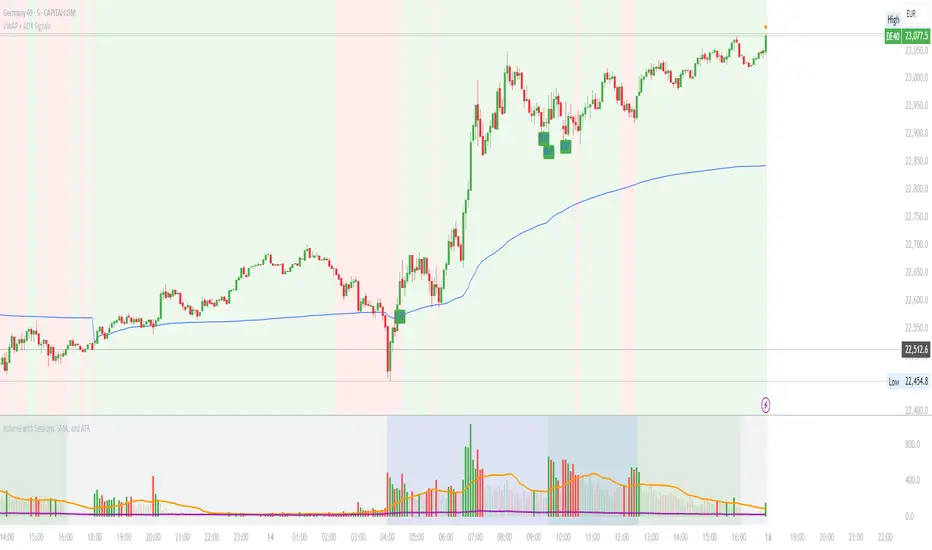
VWAP with ADX Buy/Sell Signals and 50 MA BackgroundThis Pine Script combines several technical indicators to create a comprehensive chart with buy and sell signals based on the ADX and VWAP, as well as background color changes depending on the price relative to the 50-period simple moving average (SMA). Here's a breakdown of what each part of the code does:
1. VWAP Settings
Anchor Period: You can select different periods such as "Session", "Week", "Month", etc. to define the anchor period for the VWAP.
Source: The source for VWAP is set to the typical price (hlc3).
Offset: Allows for shifting the VWAP by a specified amount.
2. ADX Settings
ADX Length: The period used to calculate the ADX.
ADX Smoothing: Used to smooth the ADX for better clarity.
ADX Threshold: Used to filter out weak trends (i.e., signals when ADX > 20).
3. ADX and VWAP Calculation
The ADX values are calculated using ta.dmi(), which returns the +DI, -DI, and ADX lines.
VWAP is calculated using ta.vwap(), based on the selected price source.
4. Buy/Sell Conditions
Buy Signal: A buy signal is generated when:
The +DI crosses above the -DI (indicating an uptrend).
The ADX is above 20 (indicating a strong trend).
The closing price is above the VWAP (indicating bullish market sentiment).
Sell Signal: A sell signal occurs when:
The -DI crosses above the +DI (indicating a downtrend).
The ADX is above 20 (indicating a strong trend).
The closing price is below the VWAP (indicating bearish market sentiment).
5. VWAP Bands
The standard deviation of the price is calculated using ta.stdev(), and the bands are plotted at multiples of the standard deviation (1, 2, and 3).
These bands are used to highlight possible overbought or oversold conditions.
6. 50-period SMA and Background Color
The script calculates a 50-period Simple Moving Average (SMA).
The background color is then changed based on whether the price is above or below the 50-period SMA. If the price is above the SMA, the background is green (bullish), and if it’s below, it’s red (bearish).
7. Plots
The script includes plots for the VWAP line, the ADX and DI lines (optional), and the upper and lower bands.
The buy and sell signals are plotted as shapes with text labels ("BUY" and "SELL") that appear below or above the price bars.
Final Notes:
Band Plots: Three levels of bands (green, olive, teal) are plotted using standard deviation multipliers (1, 2, and 3 times the standard deviation).
Background Color: The background color changes depending on whether the price is above or below the 50 SMA, giving a visual cue for bullish or bearish market conditions.
This indicator aims to offer a multi-faceted view of the market with trend-following signals (via ADX), VWAP for intraday support/resistance, and background coloring to indicate the current trend strength based on the 50 SMA.
3x Supertrend + EMA200 Signal Buy/Sell [nsen]The indicator uses signals from three Supertrend lines to determine whether to trade Buy or Sell, with the assistance of a moving average for bias.
Buy/Sell signals are generated when the conditions are met:
A Buy signal is triggered when all three Supertrend lines indicate a bullish trend and are above the EMA.
A Sell signal is triggered when all three Supertrend lines indicate a bearish trend and are below the EMA.
Indicator ใช้สัญญาณจาก Supertrend ทั้งหมด 3 เส้น โดยใช้ในการกำหนดว่าจะเลือกเทรด Buy หรือ Sell โดยการใช้ moveing average เข้ามาช่วยในการ bias
แสดงสัญญาณ Buy/Sell เมื่อเข้าเงื่อนไข
- Supertrend ทั้ง 3 เส้นเป็นสัญญาณ Bullish และอยู่เหนือเส้น EMA จะเปิดสัญญาณ Buy
- Supertrend ทั้ง 3 เส้นเป็นสัญญาณ Bearish และอยู่ใต้เส้น EMA จะเปิดสัญญาณ Sell

RSI with Bollinger Bands and Buy/Sell SignalsPurpose:
This indicator combines the Relative Strength Index (RSI) with Bollinger Bands to identify overbought and oversold conditions in the market. It also generates buy and sell signals based on the interaction between the RSI and the Bollinger Bands. It is particularly useful for traders looking for opportunities in volatile or trending markets.
How It Works:
RSI (Relative Strength Index):
The RSI measures the magnitude of recent price changes to evaluate whether an asset is overbought (values > 70) or oversold (values < 30).
In this indicator, horizontal lines at levels 70 (overbought) and 30 (oversold) are used as reference points.
Bollinger Bands:
Bollinger Bands are calculated around a smoothed moving average of the RSI. The upper band represents dynamic overbought levels, while the lower band indicates dynamic oversold levels.
These bands automatically adjust their width based on the volatility of the RSI, allowing them to adapt to different market conditions.
Buy and Sell Signals:
Buy Signal: A buy signal is generated when the RSI exceeds both the upper Bollinger Band and the overbought level (70). This suggests that the asset is in an extreme bullish phase.
Sell Signal: A sell signal is generated when the RSI falls below both the lower Bollinger Band and the oversold level (30). This suggests that the asset is in an extreme bearish phase.
Alerts:
The indicator includes automatic alerts to notify you when buy or sell signals are generated. This allows traders to act quickly on new opportunities.
Best Practices:
Confirmation in Lower Timeframes:
Although this indicator is powerful, it is recommended to confirm signals in lower timeframes before making trading decisions. For example:
If you receive a buy signal on a 4-hour chart, check if the RSI and Bollinger Bands on lower timeframes (such as 1 hour or 15 minutes) also show bullish signals.
This reduces the risk of false positives and increases the accuracy of your entries.
Use in Trends:
This indicator works best in markets with clear trends. In sideways or low-volatility markets, signals may be less reliable due to the lack of directional momentum.
Risk Management:
Always use stop-loss and take-profit to protect your positions. Buy and sell signals are just one tool for analysis; they do not guarantee results.
Combination with Other Indicators:
To improve accuracy, consider combining this indicator with others, such as MACD, Stochastic Oscillator, or Japanese candlestick patterns. This can provide additional confirmation before opening a position.
Summary:
The RSI + Bollinger Bands with Buy/Sell Signals indicator is an advanced tool designed to identify entry and exit points in the market based on extreme overbought and oversold conditions. However, to maximize its effectiveness, it is crucial to confirm signals in lower timeframes and use it in combination with other technical analysis tools. With proper risk management and careful interpretation of signals, this indicator can be a valuable ally in your trading strategy.

Multi-Indicator Signals with Selectable Options by DiGetMulti-Indicator Signals with Selectable Options
Script Overview
This Pine Script is a multi-indicator trading strategy designed to generate buy/sell signals based on combinations of popular technical indicators: RSI (Relative Strength Index) , CCI (Commodity Channel Index) , and Stochastic Oscillator . The script allows you to select which combination of signals to display, making it highly customizable and adaptable to different trading styles.
The primary goal of this script is to provide clear and actionable entry/exit points by visualizing buy/sell signals with arrows , labels , and vertical lines directly on the chart. It also includes input validation, dynamic signal plotting, and clutter-free line management to ensure a clean and professional user experience.
Key Features
1. Customizable Signal Types
You can choose from five signal types:
RSI & CCI : Combines RSI and CCI signals for confirmation.
RSI & Stochastic : Combines RSI and Stochastic signals.
CCI & Stochastic : Combines CCI and Stochastic signals.
RSI & CCI & Stochastic : Requires all three indicators to align for a signal.
All Signals : Displays individual signals from each indicator separately.
This flexibility allows you to test and use the combination that works best for your trading strategy.
2. Clear Buy/Sell Indicators
Arrows : Buy signals are marked with upward arrows (green/lime/yellow) below the candles, while sell signals are marked with downward arrows (red/fuchsia/gray) above the candles.
Labels : Each signal is accompanied by a label ("BUY" or "SELL") near the arrow for clarity.
Vertical Lines : A vertical line is drawn at the exact bar where the signal occurs, extending from the low to the high of the candle. This ensures you can pinpoint the exact entry point without ambiguity.
3. Dynamic Overbought/Oversold Levels
You can customize the overbought and oversold levels for each indicator:
RSI: Default values are 70 (overbought) and 30 (oversold).
CCI: Default values are +100 (overbought) and -100 (oversold).
Stochastic: Default values are 80 (overbought) and 20 (oversold).
These levels can be adjusted to suit your trading preferences or market conditions.
4. Input Validation
The script includes built-in validation to ensure that oversold levels are always lower than overbought levels for each indicator. If the inputs are invalid, an error message will appear, preventing incorrect configurations.
5. Clean Chart Design
To avoid clutter, the script dynamically manages vertical lines:
Only the most recent 50 buy/sell lines are displayed. Older lines are automatically deleted to keep the chart clean.
Labels and arrows are placed strategically to avoid overlapping with candles.
6. ATR-Based Offset
The vertical lines and labels are offset using the Average True Range (ATR) to ensure they don’t overlap with the price action. This makes the signals easier to see, especially during volatile market conditions.
7. Scalable and Professional
The script uses arrays to manage multiple vertical lines, ensuring scalability and performance even when many signals are generated.
It adheres to Pine Script v6 standards, ensuring compatibility and reliability.
How It Works
Indicator Calculations :
The script calculates the values of RSI, CCI, and Stochastic Oscillator based on user-defined lengths and smoothing parameters.
It then checks for crossover/crossunder conditions relative to the overbought/oversold levels to generate individual signals.
Combined Signals :
Depending on the selected signal type, the script combines the individual signals logically:
For example, a "RSI & CCI" buy signal requires both RSI and CCI to cross into their respective oversold zones simultaneously.
Signal Plotting :
When a signal is generated, the script:
Plots an arrow (upward for buy, downward for sell) at the corresponding bar.
Adds a label ("BUY" or "SELL") near the arrow for clarity.
Draws a vertical line extending from the low to the high of the candle to mark the exact entry point.
Line Management :
To prevent clutter, the script stores up to 50 vertical lines in arrays (buy_lines and sell_lines). Older lines are automatically deleted when the limit is exceeded.
Why Use This Script?
Versatility : Whether you're a scalper, swing trader, or long-term investor, this script can be tailored to your needs by selecting the appropriate signal type and adjusting the indicator parameters.
Clarity : The combination of arrows, labels, and vertical lines ensures that signals are easy to spot and interpret, even in fast-moving markets.
Customization : With adjustable overbought/oversold levels and multiple signal options, you can fine-tune the script to match your trading strategy.
Professional Design : The script avoids clutter by limiting the number of lines displayed and using ATR-based offsets for better visibility.
How to Use This Script
Add the Script to Your Chart :
Copy and paste the script into the Pine Editor in TradingView.
Save and add it to your chart.
Select Signal Type :
Use the "Signal Type" dropdown menu to choose the combination of indicators you want to use.
Adjust Parameters :
Customize the lengths of RSI, CCI, and Stochastic, as well as their overbought/oversold levels, to match your trading preferences.
Interpret Signals :
Look for green arrows and "BUY" labels for buy signals, and red arrows and "SELL" labels for sell signals.
Vertical lines will help you identify the exact bar where the signal occurred.
Tips for Traders
Backtest Thoroughly : Before using this script in live trading, backtest it on historical data to ensure it aligns with your strategy.
Combine with Other Tools : While this script provides reliable signals, consider combining it with other tools like support/resistance levels or volume analysis for additional confirmation.
Avoid Overloading the Chart : If you notice too many signals, try tightening the overbought/oversold levels or switching to a combined signal type (e.g., "RSI & CCI & Stochastic") for fewer but higher-confidence signals.

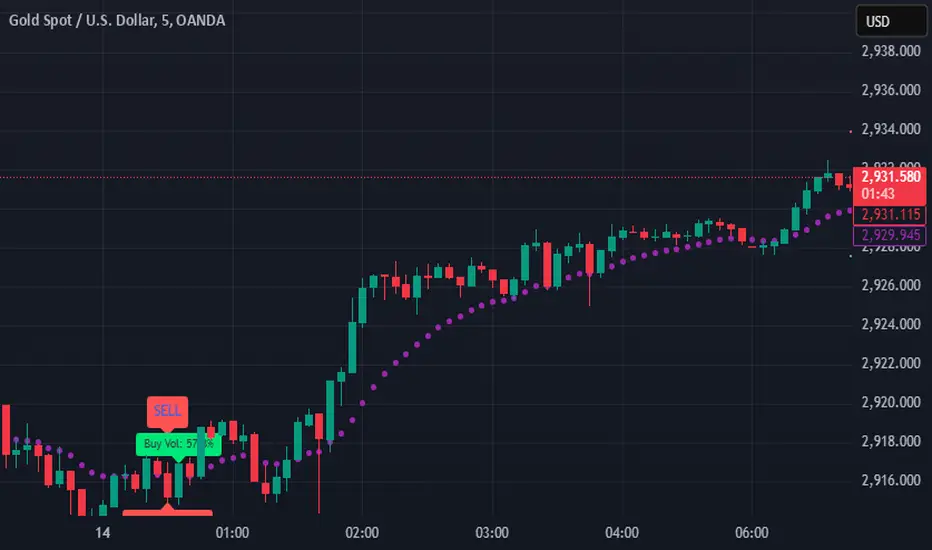
SIOVERSE EMA 15 with Buy/Sell Signals, Support & ResistanceThis Pine Script indicator is designed for TradingView and combines Exponential Moving Averages (EMAs), support and resistance levels, buy/sell signals, and volume percentage labels filtered by buy/sell conditions. It is a comprehensive tool for traders who want to analyze price trends, identify key levels, and make informed decisions based on volume and EMA crossovers.
Key Features of the Indicator
EMA 15 (Purple Dashed Line):
A 15-period Exponential Moving Average (EMA) is plotted on the chart as a dashed purple line.
This EMA helps traders identify short-term trends and potential entry/exit points.
Hidden EMA 21 and EMA 34:
The 21-period and 34-period EMAs are calculated but not displayed on the chart.
These EMAs are used to generate buy and sell signals based on crossovers.
Buy/Sell Signals:
Buy Signal: Occurs when the EMA 21 crosses above the EMA 34. A green "BUY" label is displayed below the candle.
Sell Signal: Occurs when the EMA 21 crosses below the EMA 34. A red "SELL" label is displayed above the candle.
These signals help traders identify potential trend reversals or continuations.
Support and Resistance Levels:
Support: The lowest price level over the last lookback_period candles, plotted as a green dashed horizontal line.
Resistance: The highest price level over the last lookback_period candles, plotted as a red dashed horizontal line.
These levels help traders identify key price zones for potential breakouts or reversals.
Volume Percentage Labels (Filtered by Buy/Sell Signals):
The volume percentage is calculated relative to the average volume over the last volume_lookback candles.
Buy Volume Label: When a buy signal occurs, a green label is displayed above the candle with the text "Buy Vol: X.XX%", where X.XX is the volume percentage.
Sell Volume Label: When a sell signal occurs, a red label is displayed below the candle with the text "Sell Vol: X.XX%", where X.XX is the volume percentage.
These labels help traders assess the strength of the buy/sell signals based on volume.
Alerts:
Alerts are triggered when buy or sell signals occur, notifying traders of potential trading opportunities.
Multi-Moving Average Buy/Sell IndicatorThis Multi-Moving Average Buy/Sell Indicator is a powerful and customizable tool designed to help traders identify potential buy and sell signals based on the interaction between price and multiple moving averages. Whether you're a day trader, swing trader, or long-term investor, this indicator provides clear visual cues and alerts to help you make informed trading decisions.
Key Features
1. Multiple Moving Averages
The indicator calculates four key moving averages:
9-period MA
20-period MA
50-period MA
180-period MA
You can choose the type of moving average:
SMA (Simple Moving Average)
EMA (Exponential Moving Average)
WMA (Weighted Moving Average)
2. Custom Timeframe
Select a custom timeframe from a user-friendly dropdown menu:
1 Minute
5 Minutes
15 Minutes
30 Minutes
1 Hour
4 Hours
Daily
Weekly
The indicator dynamically adjusts to the selected timeframe, making it suitable for all trading styles.
3. Buy/Sell Signals
Buy Signal: Triggered when the price crosses above any of the moving averages.
Sell Signal: Triggered when the price crosses below any of the moving averages.
Signals are displayed as labels on the chart:
Green "BUY" Label: Below the bar when a buy signal is triggered.
Red "SELL" Label: Above the bar when a sell signal is triggered.
4. Visualization
Toggle the visibility of all moving averages using the showAllMAs input.
Moving averages are plotted with distinct colors for easy identification:
9 MA: Blue
20 MA: Orange
50 MA: Purple
180 MA: Teal
5. Alerts
The indicator generates alerts for buy and sell signals, which can be used for notifications or automated trading.
How to Use
Add the Indicator:
Open TradingView and go to the Pine Script Editor.
Copy and paste the script into the editor.
Click Add to Chart.
Configure Inputs:
maType: Choose the type of moving average (SMA, EMA, WMA).
timeframe: Select a custom timeframe (e.g., "1 Minute", "Daily").
showSignals: Toggle to show or hide buy/sell signals.
showAllMAs: Toggle to show or hide all moving averages.
Interpret the Signals:
Look for green "BUY" labels below the bars for potential buy opportunities.
Look for red "SELL" labels above the bars for potential sell opportunities.
Set Alerts:
Use the built-in alert system to get notified when buy or sell signals are triggered.
Example Use Cases
Day Trading
Use a 1-minute or 5-minute timeframe with an EMA for quick signals.
Example Inputs:
maType = "EMA"
timeframe = "5 Minutes"
showAllMAs = true
Swing Trading
Use a daily timeframe with an SMA for longer-term signals.
Example Inputs:
maType = "SMA"
timeframe = "Daily"
showAllMAs = false
Why Use This Indicator?
Versatility: Suitable for all trading styles and timeframes.
Customization: Choose your preferred moving average type and timeframe.
Clear Signals: Easy-to-read buy/sell labels and moving averages.
Alerts: Never miss a trading opportunity with built-in alerts.
Limitations
False Signals:
The indicator may generate false signals in choppy or sideways markets. Always combine it with other tools (e.g., RSI, volume analysis) for better accuracy.
Timeframe Dependency:
The effectiveness of the signals depends on the selected timeframe. Shorter timeframes may produce more signals but with higher noise.
No Backtesting:
The script does not include backtesting functionality. Test the strategy manually on historical data.
Customization Options
Add More Moving Averages: Modify the script to include additional moving averages (e.g., 200 MA).
Change Signal Logic: Adjust the conditions for buy/sell signals (e.g., require confirmation from multiple moving averages).
Add Alerts for Specific MAs: Create separate alerts for signals based on specific moving averages (e.g., only 9 MA or 50 MA).
